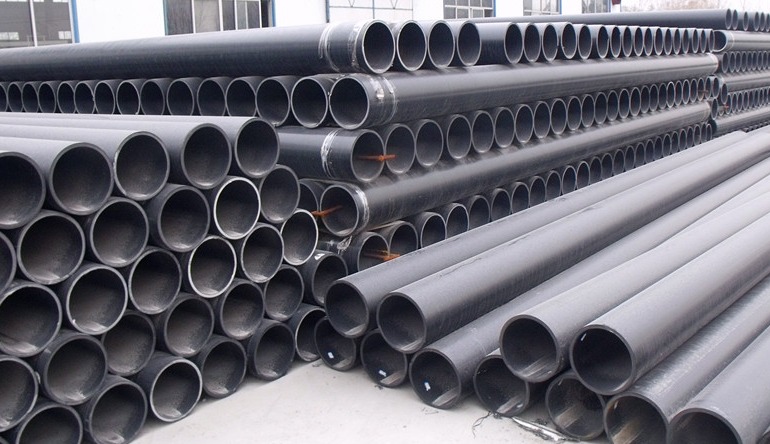


Which Chinese provinces produced the most plastic products?
According to the data from the National Bureau of Statistics of China, from January to June, the total output of plastic products in the country reached 38.424 million tons, reflecting a year-on-year (YOY) increase of 5.0%.
Output by product
During this period, the output of plastic films was 9.178 million tons, marking a YOY increase of 5.5% (including agricultural film production of 405,000 tons, up 4.0%). The output of foam plastic products was 1.311 million tons, a drop of 1.2%; synthetic leather production reached 1.12 million tons, down 0.9%; daily plastic product output was 2.66 million tons, down 1.2%; while other plastic products totaled 24.155 million tons, up 8.7%.
Output by province
From January to June, Guangdong Province produced 6.79 million tons of plastic products, an increase of 5.4%, while Zhejiang Province's output was 6.558 million tons, reflecting a decrease of 0.4%.
Combined, the production from Guangdong and Zhejiang accounted for 34.7% of the national total, solidifying their leading position in the industry. The total output of plastic products from the top ten provinces during this period reached 31.302 million tons, contributing to 81.4% of the national total.
Province | Production (in million tons) | Change (%) | Proportion (%) |
Guangdong | 6.79 | 5.4 | 17.7 |
Zhejiang | 6.558 | -0.4 | 17.1 |
Hubei | 4.05 | 51.5 | 10.5 |
Jiangsu | 3.094 | 1.3 | 8.1 |
Fujian | 2.643 | -0.4 | 6.9 |
Shandong | 2.528 | 11.7 | 6.6 |
Anhui | 1.934 | 6.2 | 5.0 |
Sichuan | 1.338 | 12.6 | 3.5 |
Hunan | 1.284 | -17.6 | 3.3 |
Hebei | 1.083 | -14.3 | 2.8 |
The output of plastic products from the top ten provinces from January to June 2025.
Industry profitability
The data from the National Bureau of Statistics of China indicates that the number of enterprises above a designated size in the plastic products sector continued to grow steadily in the first half of 2025.
A total of 24,142 large-scale enterprises reported a YOY increase of 2.9% in main operating revenue. However, total profits decreased by 1.3%, highlighting that the overall profitability of the industry remains weak amid various complex factors.
Despite the challenges facing the industry, most product categories experienced growth. Notably, revenue in plastic film, synthetic leather and artificial leather, as well as plastic ropes, strings, and woven product, all maintained a stable upward trend.
Product category | Revenue (RMB, in billions) | Change (%) | Proportion (%) |
Plastic film | 205.9 | 6.9 | 18.7 |
Plastic sheet, pipe, and profile | 157.51 | 0.3 | 14.3 |
Plastic rope, string, and woven product | 68.52 | 4.6 | 6.2 |
Foam plastic | 43.96 | 3.2 | 4.0 |
Synthetic leather and artificial leather | 39.36 | 6.98 | 3.6 |
Plastic packaging box and container | 88.68 | 1.3 | 8.0 |
Daily plastic product | 95.3 | -2.1 | 8.6 |
Artificial turf | 4.59 | -4.2 | 0.4 |
Plastic part and other unclassified plastic products | 399.01 | 3.4 | 36.2 |
All products | 1102.84 | 2.9 | 100.0 |
The revenue of plastic product categories from January to June 2025.